In earlier days, heat was thought of as a weightless fluid that could pass from one body to another.
1760 Joseph Black, a professor at Glasgow University, introduced the concept of specific heat as "the capacity for heat fluid".
1798 Count Rumford of Munich (Benjamin Thompson), when boring cannon barrels, found that it was possible to create any quantity of heat from mechanical work by means of friction.
1842 The equivalence of heat and mechanical energy was first formulated by a physician from Heilbronn, Robert Mayer. He also calculated the conversion factor based on the experimental data provided by Gay-Lussac. The famous editor Poggendrof refused to publish Mayer's paper in Annalen der Physik. Later, it was accepted by Liebig and published in Annalen der Chemie und Pharmazie.
1843 James Prescott Joule determined the value of the mechanical equivalent of heat, having had no previous knowledge of Mayer's work.
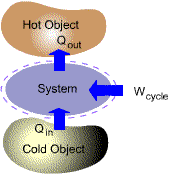
Many important practical applications such as power generation, vehicle
propulsion and refrigeration involve thermodynamic cycles.
![]()
![]()
|
Two
General Classes of Cycles
|
||
| (a) Power Cycles | ||
| (b) Refrigeration/Heat Pump Cycles |
|
|
 |
|||||||||||||
|
|
 |
||||||||||
The number of independent properties required to specify the state of
a system is one plus the number of relevant work interactions.
A system for which there is only one way the system energy can be altered
by work as the system undergoes a quasi-equilibrium process.
p = p(T, v)
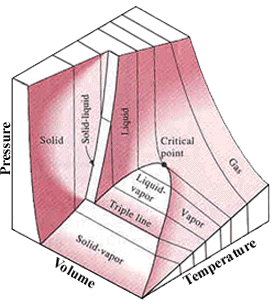
In single-phase regions (solid,
liquid and vapor), the state is fixed by any two of the properties.
Two-phase regions: where two phases coexist in equilibrium. (vaporization,
melting and sublimation)
Within the two-phase regions, pressure and temperature are not independent.
|
P-v-T diagram of a substance that contracts on freezing |
 P-v-T diagram of a substance that expands on freezing |
Reference: Cengel, Y. A. and Boles, M. A., "Thermodynamics: An Engineering Approach", 3rd ed., WCB/McGraw-Hill, Boston, 1998. |
|
A state at which a phase change begins or ends.
Intersection of saturated liquid and saturated vapor lines. The critical
temperature of a pure substance is the maximum temperature at which liquid
and vapor phases can coexist in equilibrium.
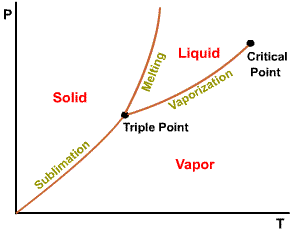
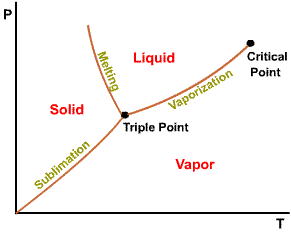
The projection of P-v-T surface on the pressure-temperature plane.
 |
 |
|
|
Phase
diagram of substances that |
Phase
diagram of substances that
expand on freezing |
|
The temperature at which a phase change takes place at a given pressure.
Triple point of water - T = 273.16 K and p = 0.6113 kPa
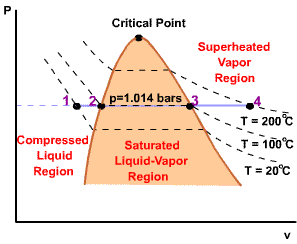
| For any specified temperature less than the critical temperature, pressure remains constant in the two-phase region, but in the single-phase liquid and vapor regions the pressure decreases at a fixed temperature as the specific volume increases. The critical isotherm passes through a point of inflection at the critical point and the slope is zero there. | 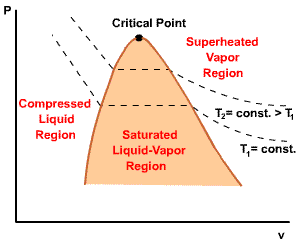 |
|
| For pressure less than the critical pressure, the pressure remains constant with the temperature in the two-phase region. In the single-phase liquid and vapor regions, the temperature increases at a fixed pressure as the specific volume increases. | 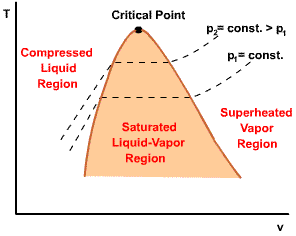 |
|
|
|
||||||||||||||||||||||
|
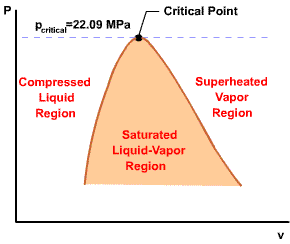
Initial state: No change in phase from liquid to vapor. At all states there would be only one phase. When the temperature and pressure are above the respective critical values, the term liquid and vapor tend to lose their significance. At such states, a state is more appropriately described as a fluid. |
 |
||||||||||||||||||||||
|
Quality
|
||
| The ratio of the mass of vapor to the total mass of mixture. | ||
| 0 (saturated liquid) < x < 1 (saturated vapor) |
