|
Two-Phase
Liquid-Vapor Mixture |
 |
|
|
Compressed
Liquid
|
Reference State:
For water: triple point (0.01
![]() )
)
For refrigerants: -40 ![]() (-40
(-40
![]() )
)
![]()
![]()
![]()
Energy transfer by heat can be represented as an area on a T-S diagram.
Mollier diagram is intended for evaluating properties at superheated vapor
states and for two-phase liquid-vapor mixture.
|
First
Law of Thermodynamics
|
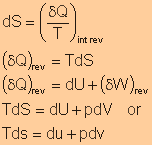
Definition
of Enthalpy
|
|
 |
 |
|
Two
Different Expressions for Entropy Change of an Ideal Gas
|
|
|
For an ideal gas, we have
|
For an ideal gas, we have
|
|
Definition
|
||
|
Standard-State
Entropy
|
|
|
|
Entropy
Change of an Ideal Gas in Terms of the Standard-State Entropy
|
||
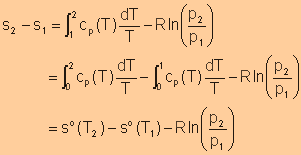 Note: Reference State: 1 atm and 0K |
||
|
Table
A-17
|
pp.
923-924
|
Ideal Gas Properties of Air | |
|
Table
A-18
to Table A-25 |
pp.
925-936
|
Ideal Gas Properties of Other Gases |
|
Isentropic
Processes of Ideal Gases with Constant Specific Heats
|
||
|
Expression a |
Expression b |
|
|

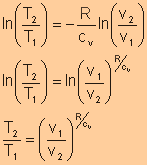
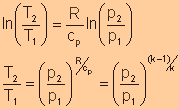
For isentropic processes, the change of entropy is zero, thus we have
For an ideal gas, Finally, we have
|
For isentropic processes, the change of entropy is zero, thus we have
|
|
|
Expression
c
|
||
|
Equate expression a and expression b, we have
|
||
|
Polytropic
Process
|
||
|
n
= 0
|
Isobaric
Process (Constant-Pressure)
|
|
|
n
= 1
|
Isothermal
Process (Constant-Temperature)
|
|
|
n
= k
|
Isentropic
Process (Constant-Entropy)
|
|
|
n
=
|
Isometric
Process (Constant-Volume)
|
|
|
Isentropic
Processes of Ideal Gases with Variable Specific Heats
|
||
|
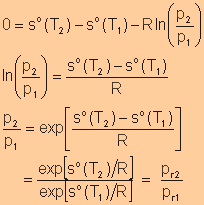
Relative
Pressure
|
Relative
Volume
|
|
|
where Note: |
Note: Do not confuse
|
|


